2 Data
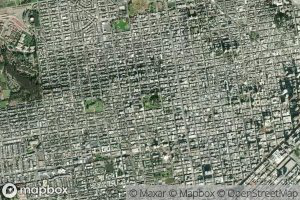
To evaluate the algorithm’s performance, we collected images with varying levels of complexity. Beginning with basic geometric shapes and diagonal lines sourced from Google Images, we established a foundational data set for initial testing. We incorporated aerial cityscapes including San Francisco, Salt Lake City, and Detroit from Mapbox, aiming to assess the algorithm’s ability in identifying urban grid structures such as streets and highways. Additionally, we included images of grass sourced from both Google Images and Dr. Jon Rosales (Environmental Studies) at St. Lawrence University’s Living Lab. The images sourced from the Living Laboratory included aerial and close-up shots, with special attention given to aerial images which featured a northern indicator line. To ensure consistent orientation, each aerial image was manually rotated to align the north facing direction upwards before analysis, with the northern indicator subsequently removed to avoid introducing artificial lines in the image.

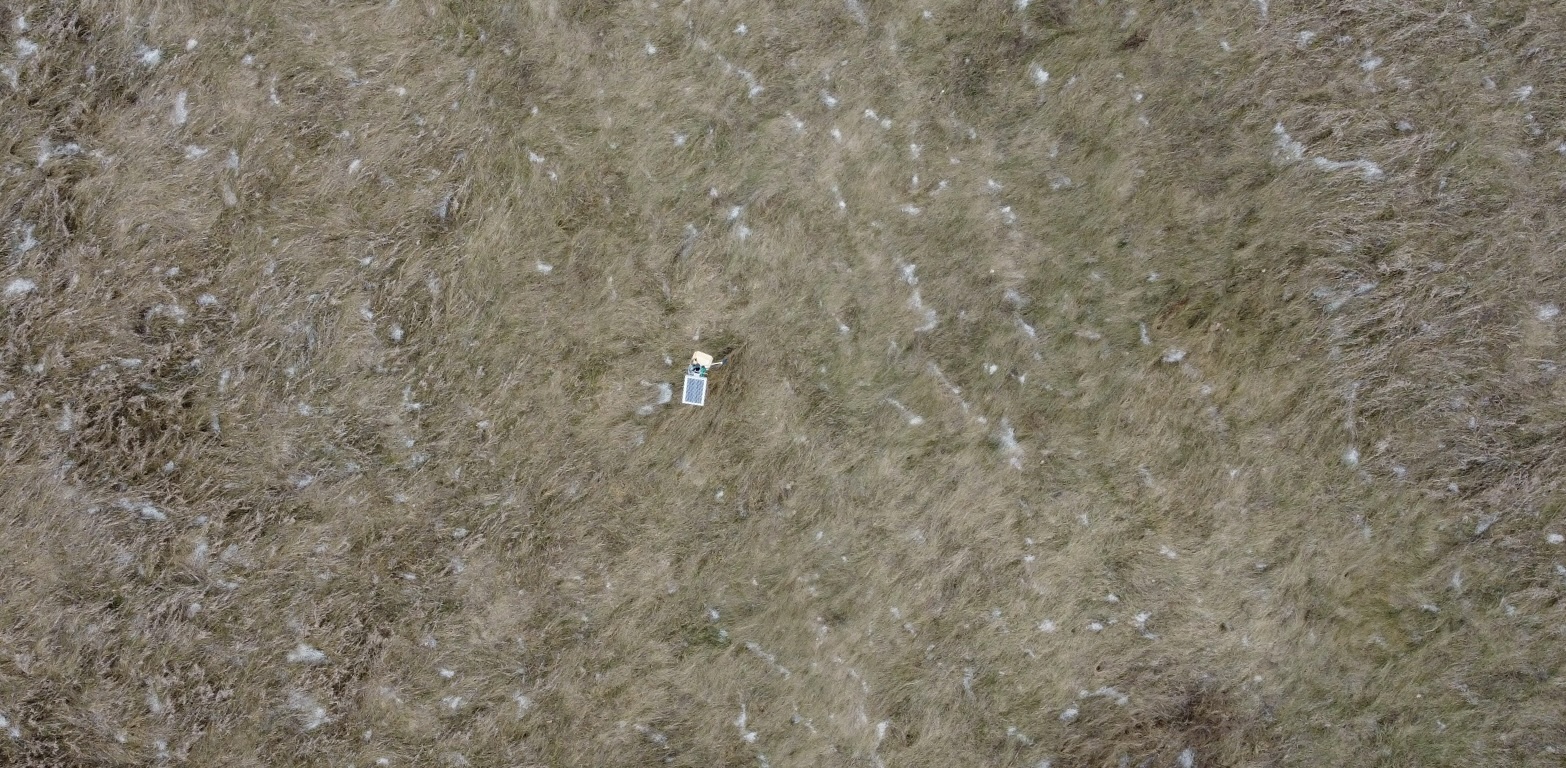
(St. Lawrence University Living Laboratory)

(St. Lawrence University)